
☕ Data Science Nanodegree Capstone Project
This project (Capstone Project) is part of Udacity’s Data Scientist Nanodegree program
Starbucks Best Offers Predictor / Analysis
Copyright: monticello/123RF. e
Project Overview
In this project, I will try to find how Starbucks customers use the app, and how well is the current offers system. I will also see who should the app target in promotions. The data sets used in this project contains simulated data that mimics customer behavior on the Starbucks rewards mobile app. From it, we can understand the costumers' behavior and it might help us make better decisions. e
Problem Statement
The problem we have here is that we don't want to give any customer our offers. We want to give only those who we think will be able to complete the offer. Giving an offer to someone we know he/she probably will not be able to complete it is a waste of time and resources that can be given to someone who we know will complete it. I will approach this problem by first cleaning up the data, then doing some exploratory analysis and see who are my most valuable customers after that I will create a model to help us predicting feature customers and which type of offer should we give them. e
My goal for this project is predicting which kind of offers, Buy One Get One Free (BOGO), Discount or informational is better to give a current customer by only knowing his/her age, gender, income and the amount they are paying. e
Metrics
The metric I used this project is accuracy. Since we have a simple classification problem, I will use accuracy to evaluate my models. We want to see how well our model by seeing the number of correct predictions vs total number of predictions. For the different models I used in this project, I checked the accuracy my training and testing data sets and decided which to choose based on it. e
Analysis

Copyright: opengridscheduler e
Business understanding
My objective here is to find patterns and show when and where to give specific offer to a specific customer. Main users of this kind of applications are Starbucks employees and analysts. The plan in this project to have questions and answer them with data visualization. Tha data is provided by Starbucks contains simulated data that mimics customer behavior. e
Data Exploration / Understanding
In this project we were given 3 files. Before I start analyzing we have to explore and see what is the data we have. We need to check if it is clean or not, if each column have the right type that the data tell, for example if the data in column called price is saved as string, we need to convert it to number to help us in the analysis if we want to find the sum for example, having it as string will not return the total of that column. Similar thing goes to dates saved as strings. e
The data we have is provided by Starbucks. Here is a quick breakthrough of how the data looks like: e
- portfolio.json - containing offer ids and meta data about each offer (duration, type, etc.)
- profile.json - demographic data for each customer
- transcript.json - records for transactions, offers received, offers viewed, and offers completed
Here is the schema and explanation of each variable in the files: e
portfolio.json - 10 rows, 6 columns. e
- id (string) - offer id
- offer_type (string) - type of offer ie BOGO, discount, informational
- difficulty (int) - minimum required spend to complete an offer
- reward (int) - reward given for completing an offer
- duration (int) - time for offer to be open, in days
- channels (list of strings)
profile.json - 17000 rows, 5 columns. e
- age (int) - age of the customer
- became_member_on (int) - date when customer created an app account
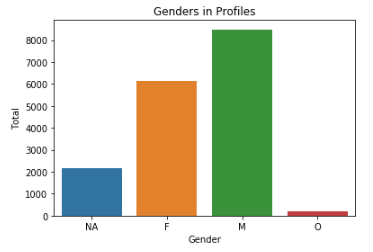
- gender (str) - gender of the customer (note some entries contain 'O' for other rather than M or F)
- id (str) - customer id
- income (float) - customer's income
transcript.json - 306534 rows, 4 columns. e
- event (str) - record description (ie transaction, offer received, offer viewed, etc.)
- person (str) - customer id
- time (int) - time in hours since start of test. The data begins at time t=0
- value - (dict of strings) - either an offer id or transaction amount depending on the record
Data preparation / Wrangling
In this part I did a lot of changes to the three tables. Here are the changes I made: e
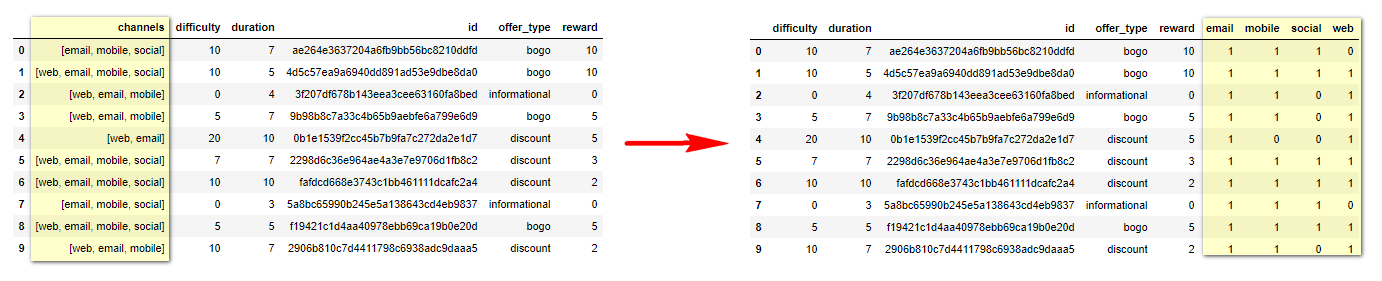
portfolio.json
channels column: this hold a list of the channels where the offer is delivered. and to fix it I one-hot-encoded it to look like this. e
profile.json
The gender and income column have NaN values. For gender, NaN were converted to NA. For income, NaN were replaced by the mean. e
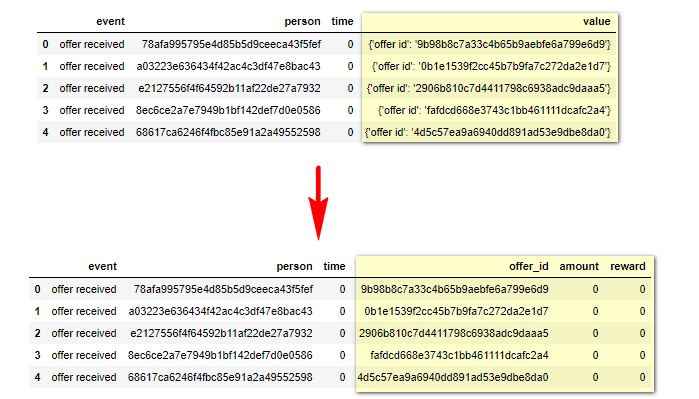
transcript.json
Similar to what we saw before in portfolio channels column, here the value column holds dictionary of offer id, amount, offer_id and reward. To fix this I will do the same think I did before with channels, one-hot-encoding, and I will combine offer_id and offer id since both means the same thing. The final result looks like this. e
Analysis
A. Univariate Exploration
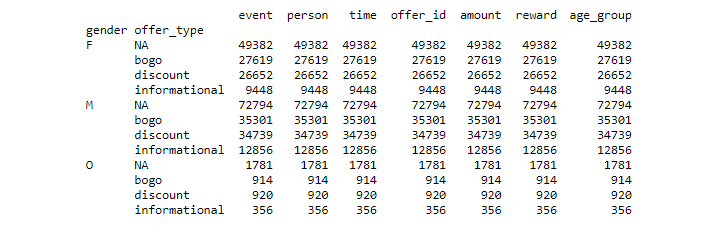
What are the most common values for each column in each data frame
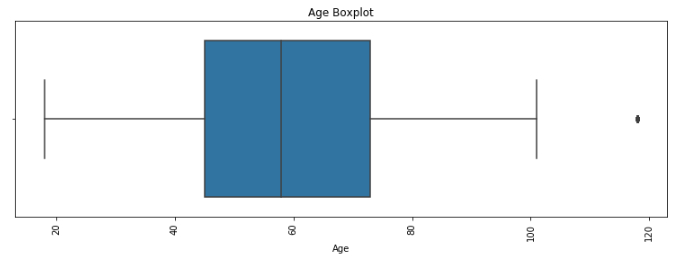
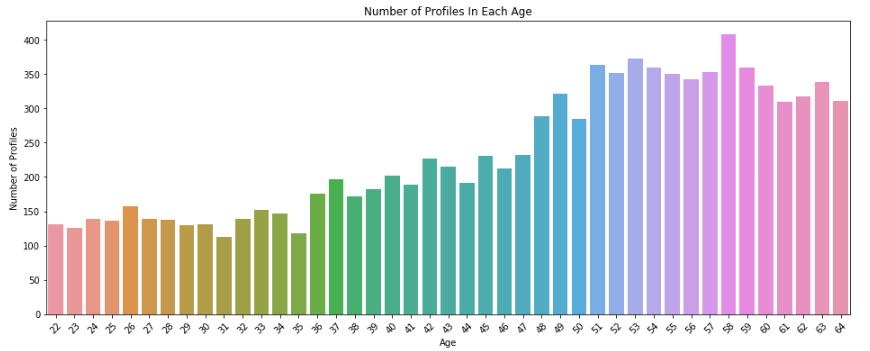
For age, we can see that most of ages in our profile data frame falls in-between 40 and 80. We already notice one outlier which is 118. Our median is around 58 years old. e
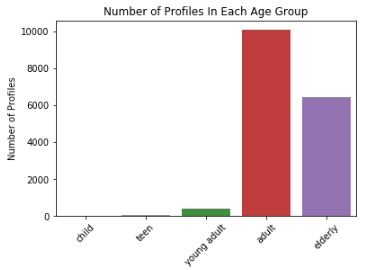
The first bar chart tell us that we have a lot profile in the adult age group, ages between 21 and 64. e
What is the average income for Starbucks customers
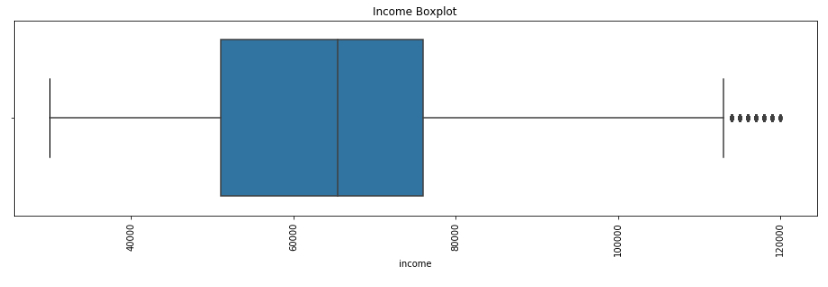
For the income, most of their income are between 50k and 78k. The exact number for average income is 65404. e
What is the average age for Starbucks customers
From what we saw in the first question, our average age is around 58. e
What is the most and least common promotion
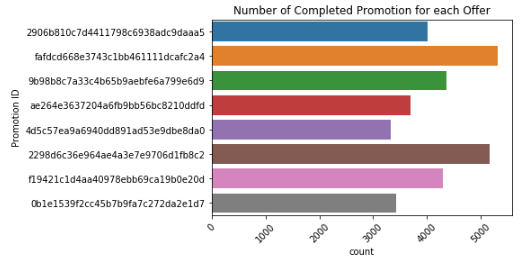
The offer ID 'fafdcd668e3743c1bb461111dcafc2a4' is the most common with number of completion equal to 5317. The least common offer is '4d5c57ea9a6940dd891ad53e9dbe8da0' with total of 3331 completion. e
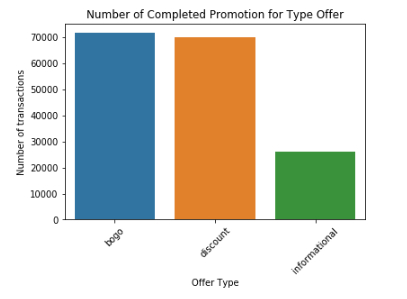
The most common types of offers is BOGO and Discounts. e
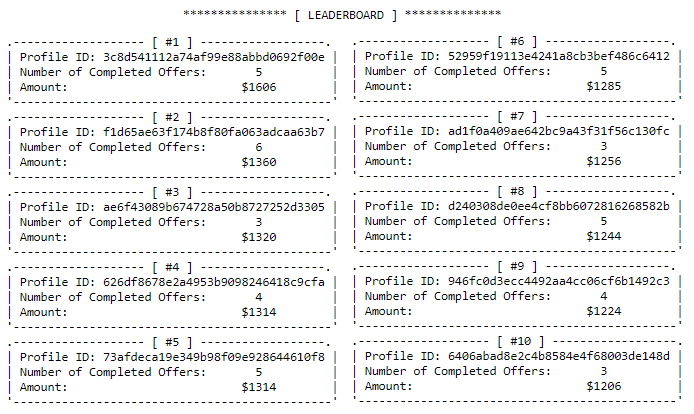
Who are the most loyal customer - most transcripts
Here are a list of the most loyal customers (customers who spends a lot of money on offers/transactions). e
What are the most events we have in our transcripts
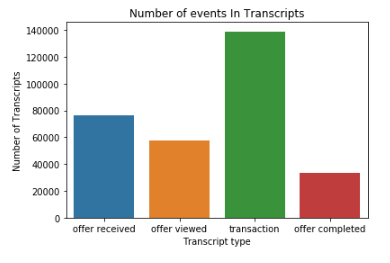
Transaction have the most amount of rows in the transcript data frame with around 140k, almost half of our data frames total. e
B. Multivariate Exploration
What is the most common promotion for children, teens, young adult, adult and elderly customers
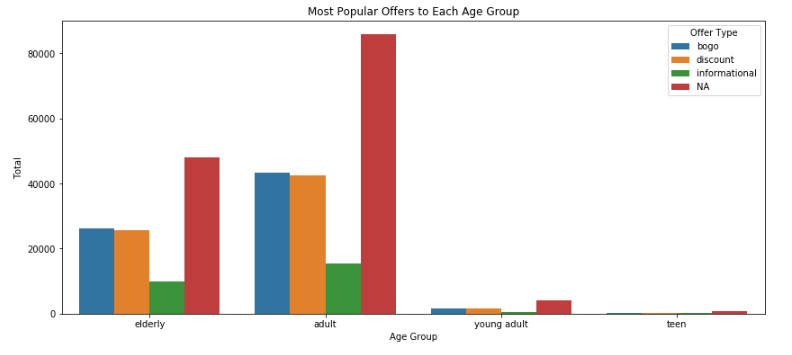
NA = Transactions. We can see that most of our customers falls in the adult and elderly group age. And they prefer Buy One Get One and Discount offers than informational offers. e
From profiles, which get more income, males or females
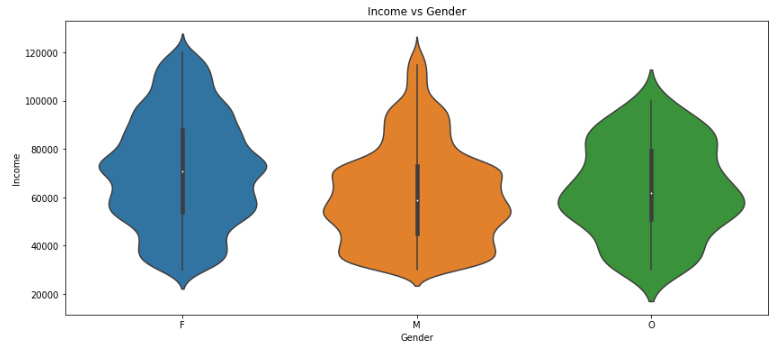
The graph above shows that income median (the white dot) for females (around 70k) is higher than males (around 60k) we can also see that for females the income spreads from 40k to 100k. For males most of them around 40k to 70k which close to median. e
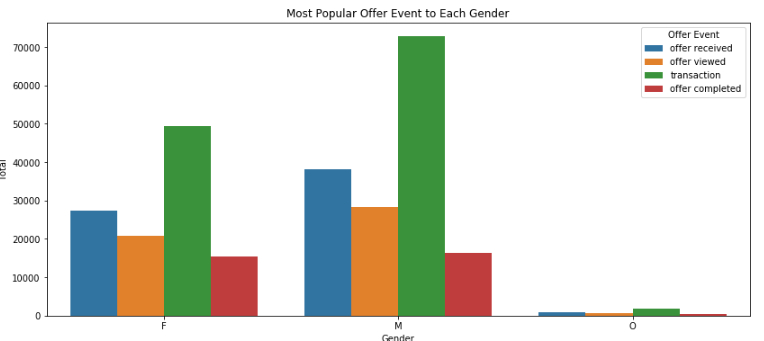
What is the gender distribution in the transcript data frame
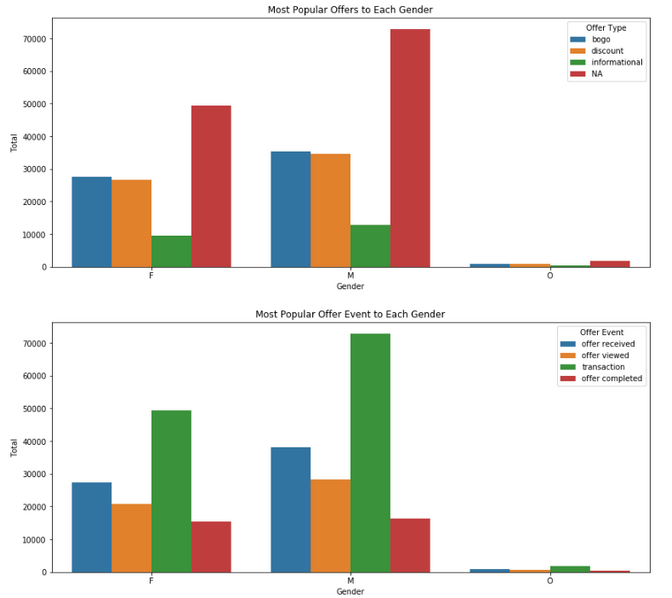
Total number of males records 155690, and total number of female records is 113101. e
From the two graphs above we can see that males received offers more than females. Both genders seems to reflect on those offers similarly. Around half of offers received were viewed by both genders, but it seems that females would complete those offers more than males. The numbers are: e
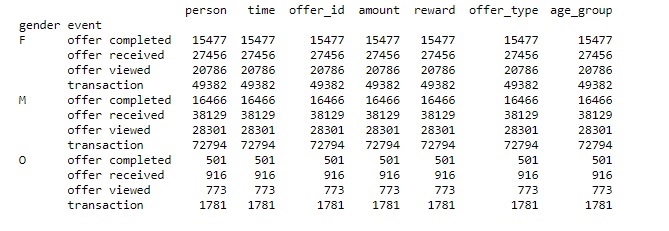
For Females: e
Total transcripts is: 113101. e
Number of bogo offers: 27619, 43.34% of total. e
Number of discount offers: 26652, 41.83% of total. e
Number of informational offers: 9448, 14.83% of total. e
Number of offer completed: 15477, 56.37% of total offers received. e
Number of offer received: 27456, 43.09% of total. e
Number of offer viewed: 20786, 32.62% of total. e
Number of transaction: 49382, 43.66% of total. e
For Males: e
Total transcripts is: 155690. e
Number of bogo offers: 35301, 42.58% of total. e
Number of discount offers: 34739, 41.91% of total. e
Number of informational offers: 12856, 15.51% of total. e
Number of offer completed: 16466, 43.18% of total offers received. e
Number of offer received: 38129, 46.0% of total. e
Number of offer viewed: 28301, 34.14% of total. e
Number of transaction: 72794, 64.36% of total. e
The numbers above shows that males receive offers more than females by 9% and their transaction is 19% more too, which tells that they both more than females. Regarding offers, Males and Females received the same amount of BOGO and discount offers. e
Who takes long time to achieve each promotion goal and from which gender, age, income
The mean time it takes a customer to complete an offer is around 16 days (390 hours). e
Which type of promotions each gender likes - offer_type
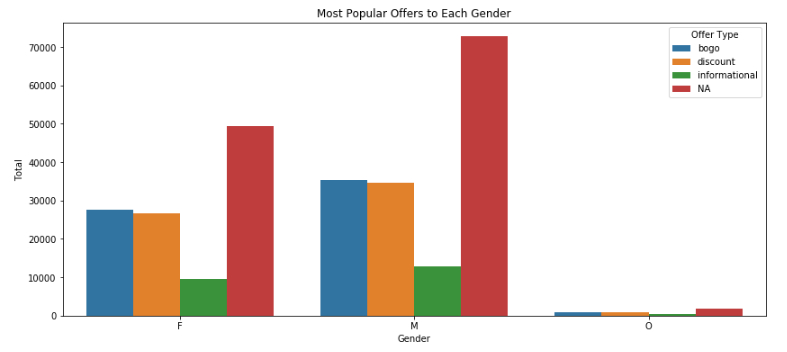
We can see that both genders like bogo and discount offers and they have the same reaction to informational offers, they both seem to be not interested to it. e
From each offer received by customer, how many they completed
For Females: e
Number of offer completed: 15477, 56.37% of total offers received. e
Number of offer received: 27456, 43.09% of total. e
Number of offer viewed: 20786, 32.62% of total. e
Number of transaction: 49382, 43.66% of total. e
For Males: e
Number of offer completed: 16466, 43.18% of total offers received. e
Number of offer received: 38129, 46.0% of total. e
Number of offer viewed: 28301, 34.14% of total. e
Number of transaction: 72794, 64.36% of total. e
Females completed 56% of the offers they received, it is 13% more than males, but males made more transactions than females, 64% to 43%. e
Model
In this part, I tried to make a model that can identify which kind of offers we should give a customer. Because my model will guess the offer_type, I will only get those transcripts with offer id's. So I will ignore all transactions without offer id for now. e
Our features here are: e
- Event. (Will be replaced from categorical to numerical)
- Time. (normalized)
- Offer_id. (Will be replaced from categorical to numerical)
- Amount. (normalized)
- Reward. (normalized)
- Age_group. (Will be replaced from categorical to numerical)
- Gender. (Will be replaced from categorical to numerical).
- Income. (normalized)
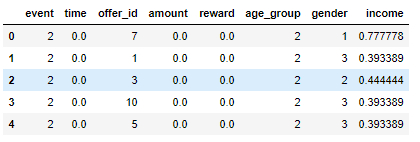
And my target is offer_type. For my target, I will replace texts with numbers. Where BOGO = 1, discount = 2, informational = 3. e
Here is how the final data frame looks like before modeling: e
The shape of my features and labels was: e
- Training Features Shape: (125685, 8)
- Training Labels Shape: (125685,)
- Testing Features Shape: (41896, 8)
- Testing Labels Shape: (41896,)
Now for the modeling part, I tried six different models and this is the results: e
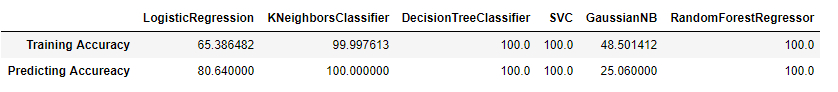
From the previous table, we can see that we scored 100% accuracy in the training and testing data sets on 4 models. To avoid over fitting I will choose Logistic Regression since it got good results 65% on training and 80% on testing data sets. Logistic Regression is better used here since we have few binomial outcomes (BOGO = 1, discount = 2, informational = 3). It is good here because we have good amount of data to work with. e
Conclusion
In this project, I tried to analyze and make model to predict the best offer to give a Starbucks customer. First I explored the data and see what I have to change before start the analysis. Then I did some exploratory analysis on the data after cleaning. From that analysis I found out that most favorite type of offers are Buy One Get One (BOGO) offers and Discount offers. I digged deep to see who and what type of customers we have and noticed that Females tend to complete offers more than males with 56% completion of the offers they received. Where Males completed only 43.18% from the offers they received. But our current data shows that we gave Males more offers since they have more transactions than Females with total number of 72794 transactions, where females only had 49382 transactions. In conclusion, the company should give more offers to Females than Males since they have more completed offers. And they should focus more on BOGO and Discount offers since they are the one that tend to make customers buy more. e
Improvements
I think I got to a point where we have good results and we understand the data we have very well. But to make our results even better, I would try to improve my data collection and fix issues I have with NaN values. I will also try to get even more data like location and when the transaction were completed, which branch and what time of the day. All these data can help us know when and where to give our offers. Also having more data is always good think to help us improve our model results. e
To see more detailed analysis with numbers and codes, check the project Github repository here. e