L2- How to Learn from Run Charts and Control Charts
Common Cause vs. Special Cause Variation
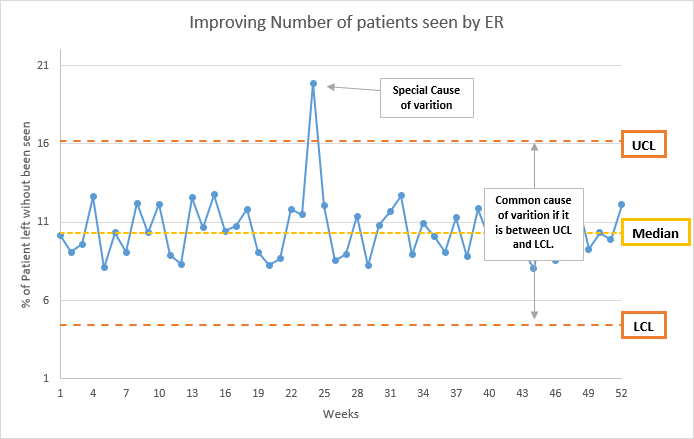
to get better results and understand better from our charts, we need to separate from common and special causes of variance.
| Common Cause | Special Cause |
|---|---|
| Inherent to the system or process | not inherent to the process |
| from regular causes | from irregular causes |
| affects on all the outcomes of a process | effects on some but not all |
| Results in a stable process that is predictable | Results in an unstable process that is not predictable |
| random variation | non-random variation |
This is how common and special causes looks like in a chart:
excel file, with the data and chart, can be found here.
Counting Runs on a Run Chart
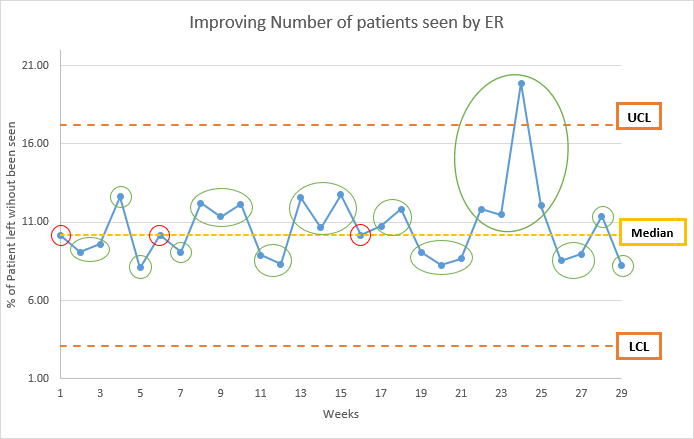
A run is one or more consecutive points that all lie on the same side of the median. To count runs, we draw circles around each run and count the circles. This example should explain how to count runs:
excel file, with the data and chart, can be found here.
In this example, we have 13 runs. Each green circle is one run. If the point is on the median line, it does not count as part of the run.
Four Rules for Interpreting Run Charts
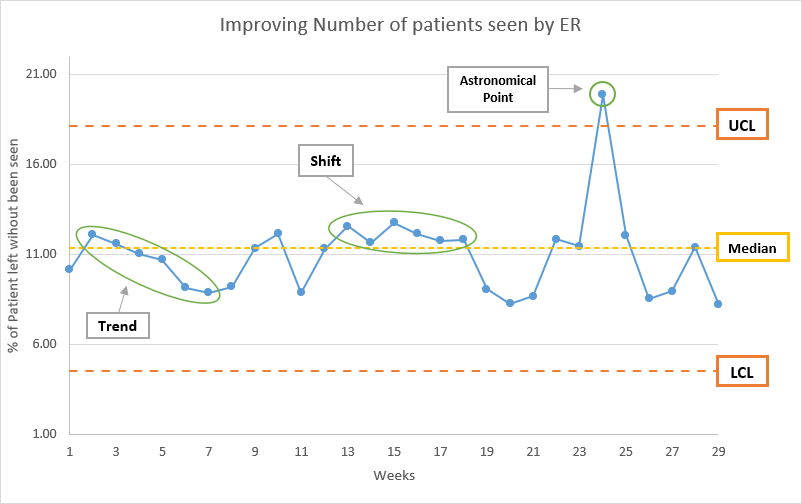
Drawing circles around runs help us finding evidence of non-random changes, signals of improvement, or deterioration. After drawing the circles, we look for the following:
- Shift: Six or more consecutive points above or below the median.
- Trend: Five or more consecutive increasing or decreasing points.
- Clusters (Too Few or Too Many Runs): We can say it is the number of runs, from that number we can tell if we have too many or too few runs.
- Astronomical Point: Abnormal change in data.
here is an example of each one:
excel file, with the data and chart, can be found here.
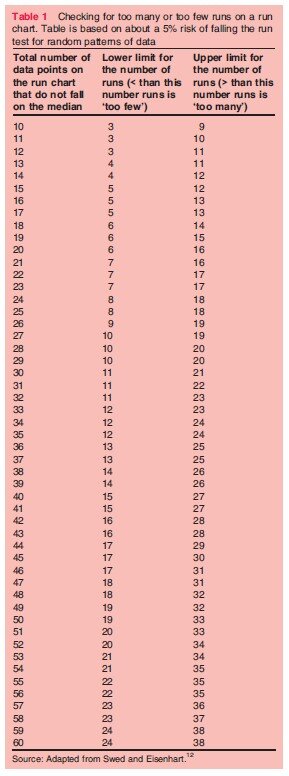
Note: For clusters, to know how many is few and how many are too many, we do the following:
- Count total data points and subtract points that fall on the median, the result is the total number of data points.
- Check the following table for the lower number of runs and the upper number of runs that the chart should have based on the total number of data points:
| data points | Lower number of runs | Upper number of runs |
|---|---|---|
| 10 | 3 | 9 |
| 11 | 3 | 10 |
| 12 | 3 | 11 |
| 13 | 4 | 11 |
| 14 | 4 | 12 |
| 15 | 5 | 12 |
This table is for 10 to 15 data points, click here if you have more than 20 data points to see how many lower and upper runs you should have.
If any of the previously explained rules occur, then we can say that there are non-random patterns in the data. That means what we are measuring is changing. Adding annotations and explaining what is happening will help nonexperienced people understand what is happening in the chart.
Rule 3: Too Many or Too Few Runs
In the previous part, I wrote the upper and lower runs for charts with 10 to 15 data points. did they decide the numbers? the formula is:
- Upper number of runs: 2 multiplied by total number of data points (already defined before) then divided by 3. If you get the result with decimals, round it down. The excel equation will be
=ROUND(2*n/3,0)wherenis total number of data points. Or=ROUND(2*n/3+0.5,0)(this is from the course) - Lower number of runs: can be found with the following excel the equation is:
=BINOM.INV(n,0.5,0.05)wherenis total number of data points. Or=ROUND(n/3-0.5,0)(this is from the course)
Check this excel file to see the result from 10 to 150 data points.
it is recommended to use the previous table since it has the correct numbers. The functions are approximations, you can use my function or the course function, the results are very close to the correct number.
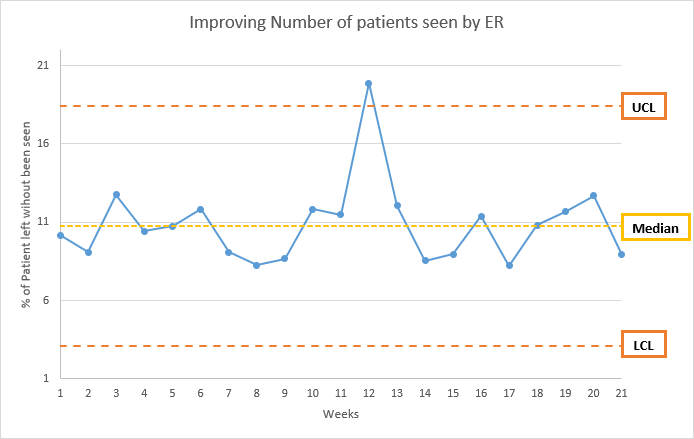
How to Read a Shewhart Chart
Shewhart Chart is also known as Control Chart. We already so how it helps us notice common cause and special cause variation. For the control chart, we need to calculate the average, lower control limit, and upper control limit. to calculate them in excel use the following function:
- Average:
=AVERAGE(column) - Upper control limit (UCL):
=AVERAGE(column) + (STDEV(column) * 2.66 ) - Lower control limit (LCL):
=AVERAGE(column) - (STDEV(column) * 2.66 )
excel file, with the data and chart, can be found here.
here we can say that all the data that fall between LCL and UCL, and not part of the four non-random patterns, is random and not abnormal. When we see any data points outside LCL or UCL then it has a special cause of variation.